Blog – Full Width

by

How the shale oil revolution has affected US oil and gasoline prices

o-FRACKING-facebookThe recent expansion of US shale oil production has captured the imagination of policymakers and industry analysts. It has fuelled visions of the US becoming independent of oil imports, of cheap US gasoline, of a rebirth of US manufacturing, and of net oil exports improving the US current account. This column asks how plausible these visions are, and examines the evidence to date.

Only a few years ago, many observers expected a steadily growing global shortage of crude oil. This shortage did not materialise in part because of the rapidly growing production of shale oil in the US. The production of shale oil (also referred to as tight oil) exploits technological advances in drilling. It involves horizontal drilling and the hydraulic fracturing (or fracking) of underground rock formations containing deposits of crude oil that are trapped within the rock. This process is used to extract crude oil that would have been impossible to release by conventional drilling methods designed for extracting oil from permeable rock formations. Shale oil production relies on the availability of suitable drilling rigs and skilled labour, which is one of the reasons why the US shale oil boom so far has been difficult to replicate in other countries.

US shale oil production has grown from about 0.4 million barrels a day in 2007 to more than 4 million barrels a day in 2014. This expansion was stimulated by the high price of crude oil after 2003, which made the application of these new drilling technologies cost competitive. The expansion of US shale oil production soon captured the imagination of policymakers and industry analysts. By 2012, the International Energy Agency projected that the US would become the world’s leading crude oil producer, overtaking Saudi Arabia by the mid-2020s and evolving into a net oil exporter by 2030 (International Energy Agency 2012). Pundits envisioned the US becoming independent of oil imports, net oil exports financing the US non-oil trade deficit, and consumers enjoying an era of cheap gasoline with a resulting rebirth of US manufacturing. My recent research, however, suggests that these visions remain far removed from reality (Kilian 2014).

Uncertainty about the US shale oil boom

To gauge the importance of shale oil for the US economy it is useful to bear in mind that, as of March 2014, shale oil accounted for almost half of US oil production, but only about a quarter of the total quantity of oil used by the US economy. This magnitude is far from negligible, but to understand the excitement about shale oil one has to consider projections of future US shale oil production.

Publicly available projections of future shale oil production have to be interpreted with some caution.

  • One concern is that increases in shale oil production are not permanent.

Sustained production requires ongoing investment. Projections by the US Energy Information Administration suggest that even under favourable conditions US shale oil production will peak by 2020 (at a level commensurate with US oil production in 1970) and then decline. Moreover, even the peak level would be far below what is needed to satisfy US oil demand.

  • A second concern is that estimates of the stock of shale oil that can be recovered using current technology are subject to considerable error.

In the summer of 2014, for example, the Energy Information Administration was forced to lower its previous estimates of the stock of recoverable shale oil by 64%.

  • A third concern is that it is not known how vulnerable the shale oil industry is to downside oil price risk.

This concern has become particularly relevant in recent months with the rapid decline in global oil prices. Shale oil production remains profitable as long as the price of oil exceeds marginal cost. There are indications that the initially high marginal cost of shale oil production has been declining substantially, as the shale oil industry has gained experience, but there are no reliable industry-level estimates of marginal cost.

In short, there is considerable uncertainty about the persistence and scope of the US shale oil boom, and there are many reasons to be skeptical of the notion that the US will soon (or indeed ever) become independent of oil imports.

Today, the US is the third-largest oil producer, slightly behind Saudi Arabia and Russia, with US crude oil accounting for about 10% of world production. Much has been made of the possibility of the US overtaking Saudi Arabia as the largest oil producer in the world, as the production of shale oil continues to surge. The implicit premise has been that being a large oil producer ensures a country’s energy security. It is easy to forget, however, that the US already was the world’s largest oil producer in 1973/1974 as well as in 1990. This fact did not protect the US economy from major foreign oil price shocks, suggesting that the focus on becoming the world’s largest oil producer is misplaced.

Imperfect substitutability between different types of crude oil

Even more importantly, the shale oil debate has largely ignored the fact that shale oil is not a perfect substitute for conventional crude oil, making comparisons across countries difficult. The quality of crude oil can be characterised mainly along two dimensions. One is the oil’s density (ranging fromlight to heavy) and is typically measured based on the American Petroleum Institute (API) gravity formula; the other is its sulphur content (with sweet referring to low-sulphur content and sour to high-sulphur content). Figure 1 provides an overview of how commonly quoted crude oil benchmarks (including West Texas Intermediate (WTI) and Brent oil in the North Sea) can be characterised along these dimensions. Shale oil consists of light sweet crude (at most 45 API), ultra-light sweet crude (about 47 API), and condensates (as high as 60API). Thus, not all shale oil is a good substitute for conventional light sweet crude oil such as the WTI or Brent benchmarks, and an aggregate analysis of the crude oil market tends to be misleading. In reality, the impact of shale has been far more complicated.

Figure 1. Classification of conventional crude oil benchmarks

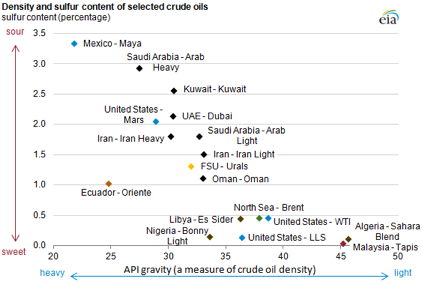
Source: US Energy Information Administration.

Notes: MARS refers to an offshore drilling site in the Gulf of Mexico. WTI = West Texas Intermediate. LLS = Louisiana Light Sweet. FSU = Former Soviet Union. UAE = United Arab Emirates.

The US shale oil boom was preceded by a persistent and growing shortage of light sweet crude oil in world markets. US refiners responded to this trend by expanding their capacity to process heavy crudes that remained in abundant supply, becoming the world leader in this field. They were therefore taken by surprise when the US market was inundated with shale crude oil from the centre of the country after 2010. Not only was much of the refining structure ill-equipped to process this light sweet crude oil, but it proved difficult to ship the shale oil to those refineries on the coasts that would have been able to process it. With the development of shale oil in the interior of the country, large parts of the US oil pipeline infrastructure developed over the preceding 40 years had suddenly become obsolete, and rail and barge transport could not cope with increased demand. Moreover, exports of US shale oil that cannot be processed domestically were (and continue to be) prohibited by US law.

The resulting local excess supply of light sweet crude oil in the central US caused the WTI price of oil to fall below the Brent price. This discrepancy between domestic and global oil prices resulted from a breakdown of arbitrage between domestic and imported light sweet crude oil. There are signs that the US refining industry is gradually responding to these price differentials. Reconfiguring the US refining and transportation infrastructure, however, is a costly and slow process. For the time being, therefore, the evolution of the US price of oil is inextricably tied to improvements in the US refining, pipeline, and rail infrastructure.

In sharp contrast, US retail fuel prices have remained integrated with the world market in part because US refined products such as gasoline or diesel (unlike domestically produced crude oil) may be exported freely. As a result, the widely noted decline in US domestic oil prices relative to international benchmarks such as Brent, has not been passed on to the consumer in the interior of the country. This point is important because it removes the basis for any notion of a rebirth of US manufacturing on the basis of low-cost US gasoline and diesel fuel.

The beneficiaries of the US shale oil boom

Thus, the main beneficiary of the US shale oil revolution has been not gasoline consumers or, for that matter, domestic shale oil producers, but the US refining industry, which enjoys a competitive advantage compared to diesel and gasoline producers abroad because of its access to low-cost crude oil. In fact, refiners have every incentive to preserve the status quo and to prevent a lifting of the US ban on exports of domestically produced crude oil. An additional beneficiary of the shale oil revolution has been the transportation sector, notably the railroad industry, and the industries directly serving the oil sector. In contrast, the macroeconomic effects on real output and employment have been small, given the negligible share of the shale oil sector in the US economy. It is fair to say that there is no support for the notion that shale oil has been a game changer for the US economy. One area in which the shale oil revolution has made a difference is in reducing crude oil imports on the one hand, and increasing exports of refined products on the other, thus improving the US trade balance (and as a side-effect dampening the effect of foreign oil price shocks on the US economy). Of course, these improvements are small compared with the overall US trade deficit.

The (lack of) impact on the global price of oil

It may seem that the rapid decline in the global price of oil after mid-2014 may be attributable to sharp increases in US shale oil production, providing direct evidence of the impact of the US shale oil revolution on oil prices after all. Although shale oil is not being exported, it replaces US crude oil imports, reducing the demand for oil in global markets, as do US exports of refined products. Some observers have gone as far as suggesting that shale oil may have become a victim of its own success in that it caused a sharp drop in global oil prices. There is no credible support for this interpretation. Similar price declines also occurred in other industrial commodity markets at the same time, suggesting that the cause of the oil price decline has not been specific to the oil sector, but that it mainly reflects a weakening global economy in Asia as well as Europe, possibly amplified by the decision of many oil producers to preserve oil revenues by increasing oil production in response to falling oil prices. This view is also consistent with the comparatively small magnitude of US shale oil production on a global scale.

By : Lutz Kilian

References

International Energy Agency (2012), World Energy Outlook 2012, Paris: OECD/IEA.

Kilian, L (2014), “The Impact of the Shale Oil Revolution on U.S. Oil and Gasoline Prices”, CEPR Discussion Paper 10304.

by

Global carbon taxation: Intuition from a back-of-the-envelope calculation

carbon_taxThe failure of markets to price carbon emissions appropriately leads to excessive fuel use and induces global warming. This column suggests a new, back-of-the-envelope rule for calculating the global carbon price. The authors find that fighting global warming requires a price of around $15 per ton of emitted CO2, or $0.13 per gallon of gasoline. The rule also highlights the importance of economic indicators, such as GDP, for climate policy.

The biggest externality on the planet is the failure of markets to price carbon emissions appropriately (Stern 2007). This leads to excessive fossil fuel use which induces global warming and all the economic costs that go with it. Governments should cease the moment of plummeting oil prices and set a price of carbon equal to the optimal social cost of carbon, where the social cost of carbon is the present discounted value of all future production losses from the global warming induced by emitting one extra ton of carbon. Our calculations suggest a price of $15 per ton of emitted CO2 or 13% per gallon gasoline. This price can be either implemented with a global tax on carbon emissions or with competitive markets for tradable emission rights and, in the absence of second-best issues, must be the same throughout the globe.

The most prominent integrated assessment model of climate and the economy is DICE (Nordhaus 2008, 2014). Such models can be used to calculate the optimal level and time path for the price of carbon. Alas, most people, including policymakers and economists, view these integrated assessment models as a ‘black box’ and consequently the resulting prescriptions for the carbon price are hard to understand and communicate to policymakers.

New rule for the global carbon price

This is why we propose a simple rule for the global carbon price, which can be calculated on the back of the envelope and approximates the correct optimal carbon price very accurately. Furthermore, this rule is robust, transparent, and easy to understand and implement. The rule depends on geophysical factors, such as dissipation rates of atmospheric carbon into oceanic sinks, and economic parameters, such as the long-run growth rate of productivity and the societal rates of time impatience and intergenerational inequality aversion. Our rule is based on the following premises.

  • First, the carbon cycle is much more sluggish than the process of growth convergence. This allows us to base our calculations on trend growth rates.
  • Second, a fifth of carbon emission stays permanently in the atmosphere and of the remainder 60% is absorbed by the oceans and the earth’s surface within a year and the rest has a half-time of three hundred years.
  • After three decades, half of the carbon has left the atmosphere. Emitting one ton of carbon thus implies that is left in the atmosphere after t years.
  • Third, marginal climate damages are roughly 2.38% of world GDP per trillion tons of extra carbon in the atmosphere.

These figures come from Golosov et al. (2014) and are based on DICE. It assumes that doubling the stock of atmospheric carbon yields a rise in global mean temperature of 3 degrees Celsius. Hence, the within-period damage of one ton of carbon after t years is

  • Fourth, the social cost of carbon is the discounted sum of all future within-period damages.

The interest rate to discount these damages r  follows from the Keyes-Ramsey rule as the rate of time impatience r  plus the coefficient of relative intergenerational inequality aversion (IIA) times the per-capita growth rate in living standards g (Foley et al. 2013). Growth in living standards thus leads to wealthier future generations that require a higher interest rate, especially if the intergenerational inequality aversion is large because current generations are then less prepared to sacrifice current consumption.

  • Fifth, it takes a long time to warm up the earth. We suppose that the average lag between global mean temperature and the stock of atmospheric carbon is 40 years.

We thus get the following back-of-the-envelope rule for the optimal social and price of carbon:

where r = p + (IIA – 1) x g Here the term in the first set of round brackets is the present discounted value of all future within-period damages resulting from emitting one ton of carbon, and the term in the second set of round brackets is the attenuation in the social cost of carbon due to the lag between the change in temperature and the change in the stock of atmospheric carbon.

Policy insights from the new rule

This rule gives the following policy insights:

  • The global price of carbon is high if welfare of future generations is not discounted much.
  • Higher growth in living standards g boosts the interest rate and thus depresses the optimal global carbon price if the intergenerational inequality aversion is larger than 1. As future generations are better off, current generations are less prepared to make sacrifices to combat global warming. However, if the aversion is less than 1, growth in living standards boosts the price of carbon.
  • Higher intergenerational inequality aversion implies that current generations are less prepared to temper future climate damages if there is growth in living standards and thus the optimal global price of carbon is lower.
  • The lag between temperature and atmospheric carbon and decay of atmospheric carbon depresses the price of carbon (the term in the second pair of brackets).
  • The optimal price of carbon rises in proportion with world GDP which in 2014 totalled 76 trillion USD.

The rule is easy to extend to allow for marginal damages reacting less than proportionally to world GDP (Rezai and van der Ploeg 2014). For example, additive instead of multiplicative damages resulting from global warming give a lower initial price of carbon, especially if economic growth is high, and a completely flat time path for the price of carbon. In general, the lower elasticity of climate damages with respect to GDP, the flatter the time path of the carbon price.

Calculating the optimal price of carbon following the new rule

Our benchmark set of parameters for our rule is to suppose trend growth in living standards of 2% per annum and a degree of intergenerational aversion of 2, and to not discount the welfare of future generations at all (g = 2%, IIA = 2, r = 0). This gives an optimal price of carbon of $55 per ton of emitted carbon, $15 per ton of emitted CO2, or $0.13 per gallon of gasoline, which subsequently rises in line with world GDP at a rate of 2% per annum.

Leaving ethical issues aside, our rule shows that discounting the welfare of future generations at 2% per annum (keeping g = 2% and IIA = 2) implies that the optimal global carbon price falls to $20 per ton of emitted carbon, $5.5 per ton of emitted CO2, or $0.05 per gallon gasoline. 

If society were to be more concerned with intergenerational inequality aversion and used a higher aversion of 4 (keeping g = 2%, r = 0), current generations would have to sacrifice less current consumption to improve climate decades and centuries ahead. This is why our rule then indicates that the initial optimal carbon price falls to $10 per ton of carbon. Taking a lower intergenerational inequality aversion of 1 and a discount rate of 1.5% per annum as in Golosov et al. (2014) pushes up the initial price of carbon to $81 per ton emitted carbon.

A more pessimistic forecast of growth in living standards of 1 instead of 2% per annum (keeping IIA = 2, r = 0) boosts the initial price of carbon to $132 per ton of carbon, which subsequently grows at the rate of 1% per annum. To illustrate how accurate our back-of-the-envelope rule is, we road-test it in a sophisticated integrated assessment model of growth, savings, investment, and climate change with endogenous transitions between fossil fuel and renewable energy and forward-looking dynamics associated with scarce fossil fuel (for details see Rezai and van der Ploeg 2014). Figure 1 below shows that our rule approximates optimal policy very well.

Figure 1. Calculating the social cost of carbon over time

The table below also confirms that our rule predicts the optimal timing of energy transitions and the optimal amount of fossil fuel to be left unexploited in the earth very accurately. Business as usual leads to unacceptable degrees of global warming (4 degrees Celsius), since much more carbon is burnt (1640 Giga tons of carbon) than in the first best (955 GtC) or under our simple rule (960 GtC). Our rule also accurately predicts by how much the transition to the carbon-free era is brought forward (by about 18 years). No wonder our rule yields almost the same welfare gain as the first best while business as usual leads to significant welfare losses (3% of world GDP).

Table 1. Transition times and carbon budget

Recent findings in the IPCC’s fifth assessment report support our findings. While it is not possible to translate their estimates of the social cost of carbon into our model in a straight-forward manner, scenarios with similar levels of global warming yield similar time profiles for the price of carbon.

Our rule for the global price of carbon is easy to extend for growth damages of global warming (Dell et al. 2012). This pushes up the carbon tax and brings forward the carbon-free era to 2044, curbs the total carbon budget (to 452 GtC) and the maximum temperature (to 2.3 degrees Celsius). Allowing for prudence in face of growth uncertainty also induces a marginally more ambitious climate policy, but rather less so. On the other hand, additive damages lead to a laxer climate policy with a much bigger carbon budget (1600 GtC) and abandoning fossil fuel much later (2077).

Conclusion

In sum, our back-of-the-envelope rule calculates the optimal global price of carbon and gives an accurate prediction of the optimal carbon tax. It highlights the importance of economic primitives, such as the trend growth rate of GDP, for climate policy. We hope that as the rule is easy to understand and communicate, it might also be easier to implement.

By : Armon Rezai, Rick van der Ploeg 

References

Dell, M, Jones, B and B Olken (2012), “Temperature shocks and economic growth: Evidence from the last half century”, American Economic Journal: Macroeconomics 4, 66-95.

Foley, D, Rezai, A and L Taylor (2013), “The social cost of carbon emissions”, Economics Letters121, 90-97.

Golosov, M, J Hassler, and P Krusell (2014), “Optimal taxes on fossil fuel in general equilibrium”,Econometrica, 82, 1, 41-88.

Nordhaus, W (2008), A Question of Balance: Economic Models of Climate Change, Yale University Press, New Haven, Connecticut.

Nordhaus, W (2014), “Estimates of the social cost of carbon: concepts and results from the DICE-2013R model and alternative approaches”, Journal of the Association of Environmental and  Resource Economists, 1, 273-312.

Rezai, A and F van der Ploeg (2014), “Intergenerational Inequality Aversion, Growth and the Role of Damages: Occam’s Rule for the Global Carbon Tax”, Discussion Paper 10292, CEPR, London.

Stern, N (2007), The Economics of Climate Change: The Stern Review, Cambridge University Press, Cambridge

by

Albania Oil, Gas & Energy 2015 Summit

IRN is pleased to introduce the inaugural

Albania Oil, Gas & Energy 2015 Summit,

17-18 March 2015 Sheraton Tirana Hotel

Taking place in Tirana, Albania, organised in collaboration with and under the Official Auspices of the Ministry of Energy & Industry.

IRN holds a very successful Mediterranean portfolio of high level meetings, the most recent of which was the Annual Balkans and the Adriatic Summit that recently hosted more than 250 senior delegates and 70 IOCs in Athens. The Albania Summit takes the regional discussions to a forum focused only on Albania to bring you exclusive updates on major developments within Albania’s energy sector by gathering all interested investment parties together with key Government Executives to discuss:

  • Upcoming licensing round of onshore and offshore blocks
  • Albania’s hydrocarbon and energy production potential
  • Energy infrastructure projects
  • Investment opportunities in gas, renewables and electricity production
  • The Trans Adriatic Pipeline (TAP): the most important development catalyst in the region

Find out how the investment legal framework encourages foreign involvement, how to get involved in upcoming energy projects, meet the key players and operators in the country and develop your entry strategy in Albania.

Why Albania:

  • A growing market with different business opportunities

  • Open-door licensing round for 12 onshore blocks and 1 offshore block

  • Europe’s largest onshore oilfield; Patos-Marinza

  • Proven oil and gas reserves

  • Amongst Europe’s largest and oldest oil and gas producers

  • Excellent fiscal initiatives

  • Major IOCs already investing in the country

  • Trans Adriatic Pipeline to supply Albania with natural gas

  • Current privatization of the petroleum sector

Key topics to be discussed at the Albania Oil, Gas & Energy 2015 Summit include:

  • An overall analysis of the Albanian onshore sector and current developments

  • New licenses onshore and offshore

  • Albania’s fascinating oil and gas history

  • Exclusive updates on Patos Marinza field

  • Developing Albania’s gas infrastructure to best fit Gas Master plan 2015

  • Fiscal and investment incentives for the Energy Sector

  • A step-by-step direction on how to acquire an exploration license in Albania

  • Gas market drivers and dynamics: Domestic and export potential

  • Plans, projects and opportunities in the Upstream, Midstream and Downstream sector

  • Transparency initiatives

For more information please contact

Chryssa Tsouraki

E: ChryssaT@irn-international.com

T: +44 (0) 207 111 1615

Web: www.albaniasummit.com/

by

World Bank Financed Power Plant Threatens Albanian Canyon

A hydropower plant, which the Austrian company ENSO is building in the Lengarica River in southern Albania with financing by the IFC, threatens to ruin a famous canyon, BIRN can reveal.

Lengarica-2-BI

The heavy-duty trucks and earth-moving machinery working to construct a hydropower plant on the Lengarica River in southern Albania, close to the Greek border, look like alien imports in this pristine natural environment.

The river has cut a four-kilometre-long canyon through the limestone in the heart of the Hotova Pine national park, which is host to a series of thermal water springs, renowned for healing qualities, as well as a 17th-century bridge.

This ensemble of natural and cultural monuments enjoys the protection of the law. However, despite the law, and the area’s natural and cultural value, the government is allowing a hydropower plant to be built on the river, even though environmentalists fear it will severely damage the canyon.

The hydropower plant is being financed by the International Finance Corporation, IFC, the commercial arm of the World Bank, and is being constructed by an Austrian company, Enso Hydro, through a local subsidiary, Lengarica & Energy.

Documents obtained by BIRN and interviews with experts and government officials show that Lengarica & Energy’s initial application for a permit was rejected, owing to its negative impact on the Lengarica canyon and Hotova Pine national park.  

However, an environmental permit for the project was ultimately approved, apparently following political pressure.

The river canyon is a natural monument enjoying Category 1 protection status under Albanian law, “which does not allow for any sort of construction,” Zamir Dedej, head of Albania’s Institute for Nature Protection, recalled.

Enso Hydro admits that the plant is being constructed in a “sensitive” natural environment, but insists that the project will have no impact on the canyon itself.

The company says that while it is using water that flows in the canyon, it is not actually building inside it, in the Category 1 area.

It also underlines that it has received all the construction permits it needs from the government – and says it is up to the authorities to monitor compliance with the permits.

“We were aware that it was a sensitive area,” Lengarica & Energy director Wolfgang Kropfl, said.

The World Bank, which controls 20 per cent of the project through its investment in Lengarica & Energy, underlines that it reviewed the project under IFC Environmental Performance Standards criteria before deciding to finance it.

Albania’s centre-left government took power in September 2013 after its predecessor had already given the project the final go-ahead. In the face of protests by environmental groups, it has set up a taskforce to review the potential environmental impact.

The Lengarica canyon is considered an exceptional natural monument owing to its geological form and the thick vegetation, which are home many species of birds.

Together with the Benja thermal springs and the 17th-century Kadiu Bridge, the canyon has drawn a growing number of tourists to the Hotova Pine national park. They have become an important source of revenue for local residents.

“People in Albania act like there is no tomorrow; they don’t think about the future,” Gorgio Ponti, coordinator of the tourists’ hospitality centre in the nearby town of Permet, complained.

“It’s paradoxical that the Albanian government wants to develop tourism in the area – and then opts to build a power plant,” he added.

We made a good deal’:langarica

The Lengarica project first took life in 2008, when the government awarded a concession to a little-known Albanian company, Hasi Energji, to build two small hydropower plants on the Lengarica.

Hasi Energji, which had little capital, then sold the concession in a series of transactions to Enso Hydro, which was scouting the possibilities of hydro power in Albania.

The Austrian company specializes in small hydropower plants, with plants in Austria, Norway and Turkey, as well as Albania.

To finance the project, Enso Hydro sought financing from the IFC and a German bank. Construction began in the summer of 2013, despite the objections of local environmental groups.

Documents secured by BIRN show that Hasi Energji originally planned to build a complex of villas near the Benja thermal spring and applied for a permit with this in mind in 2006. 

However, the company then changed its mind and applied for a concession to build two small hydropower plants, Lengarica 1 and Lengarica 2, with an installed capacity of 3,700 and 2,500kW. It obtained a contract in 2008.

When Hasi Energji obtained the concession for the plants from the Ministry of Economy, it had capital assets of only 100,000 lek (€850), the minimum required by law to register as a company. Its only business experience was in the import and export of food materials.

Astrit Dhromaj,a former shareholder in the company, says the company never intended to develop the power plants itself. “We wanted to find a foreign company [to invest], which is what we did,” he told BIRN in a telephone interview.

In 2009, the Minister of Economy, Genc Ruli signed a contract with Hasi Energji, amending the concessionary agreement that the company had received earlier and reducing the number of power plants in the concession from two to one.

However, this single plant would have a much larger installed capacity than was originally planned, of 8,906 kW.

With the amended concession in its hands, Hasi Energji created a joint company with Enso Hydro in 2011, Lengarica & Energy, which first transferred 20 per cent of the shares to the Austrians and then sold them all the remaining shares for €800,000.

On August 3, 2011, Enso Hydro took control of all the shares of Lengarica & Energy.

Hasi Energji spent between 15,000 and 20,000 euro for the concession before selling it. “This was an important project and I think we made a good deal,” Dhromaj, the former shareholder in Hasi Energji, said.

Sudden change of heart:Lengarica-3-BI

After Enso Hydro took control of the company, the project to develop the larger single hydropower plant on the Lengarica moved forward.

The one problem was that since the time that Hasi Energji first obtained a concession and an environmental permit in December 2008, the government had declared the Hotova Pine area a national park.

This decision divided the park into four zones: a core area; an area of sustainable development; a recreational area; a traditional use area.

Following its acquisition of Lengarica & Energy, Enso Hydro developed a new project for the power plant.

Water would be taken in from the upper side of the canyon and deviated through a four-kilometre underground tunnel, which would then stretch another 3.75 kilometres above ground through tubes before reaching the power plant.

Of the total flow of the river at its peak, the power plant would use 8 metric cubes per second, leaving only 0.2 metric cubes per second to flow into the canyon, which the company says is enough to sustain its ecosystem.

When Lengarica & Energy bought the concession from Hasi Energji in 2011, it also had to reapply for a new environmental permit with the Ministry of Environment because the project now extended inside the boundaries of the Hotova Pine park.

Documents obtained by BIRN show that when Lengarica & Energy first applied for an environmental permit, the Ministry of Environment rejected it on October 4th, 2011.

The commission tasked with reviewing the project said building a power plant inside a national park protected by law was not feasible.

“Implementation of this project would cause considerable negative effects and damage the canyon in breach of the 2002 law on protected areas,” the ministry said.

“The deviation of the water flow will also damage the thermal springs near Benja at the end of the canyon,” it added.

The plant could “only be built if it used the water on the lower side of the canyon, after passing the Benja thermal water springs,” it continued.  

However, after Lengarica & Energy reapplied for an environmental permit, only two months later, without changing the project, the same ministerial commission changed its mind. It approved the plant’s construction on January 21st, 2012.

A former ministry official, who spoke on condition of anonymity, told BIRN that the change of heart was the result of pressure applied by two MPs from the then ruling Democratic Party

“After I refused [to approve the project], I was fired directly on the order of the minister,” the official said.

The 2002 law on protected areas protects the Lengarica canyon from all development under Category I status. Article 5, section 2 of the law forbids all construction work in Category I areas.

However, Lengarica & Energy says this article of the law is not relevant to the project, which only involves diverting water away from the canyon, not construction work in the actual canyon.

 “If it [the work] was not allowed, the government should have not given us the environmental permit,” company lawyer Vilma Gjyshi said. “As we were granted the permit, we have a right to develop the project,” she added.

Wolfgang Kropfl, director of Lengarica & Energy, says the power plant only stretches into so-called Category 2 protected areas – and work can take place in Category 2 areas with the necessary permits.  “We are not working in the canyon,” Kropfl noted.

However, Sokol Abazaj, who worked as a consultant with Enso Hydro to develop the Lengarica project until 2012, told BIRN that Kropfl knew the project was controversial and had sought the area’s removal from the national park.  

“Lengarica & Energy asked for the area to be removed from the national park,” Abazaj maintained.

“This request was never approved by Albanian institutions, although Kropfl, administrator of Lengarica & Energy… repeated it more than once,” he added.

Abazaj claims that conflicts over the environmental consequences of the project became a source of dispute between him and Kropfl.

“I told him that in Albania… there are laws and regulations that cannot be breached,” Abazaj said. “It will come out one day in the media that there is real catastrophe there,” he added, referring to the project.

Kropfl dismisses the allegations. The company had no reason to seek the removal of the planned area of work from the national park, he said. “As the company, we did nothing about this. Why should we do any removing, or lobby for this?” he asked.

Lengarica-4-BIKropfl also argues that – by deviating water away from the canyon – the project may prevent the lower part of the river from flooding during times of peak flow.

The IFC, meanwhile, told BIRN that the project had been evaluated “according to the IFC Sustainability Framework and the IFC Environmental and Social Performance Standards, which promote the protection of biodiversity and the sustainable management of natural resources. 

“Based on information provided by the company, the Lengarica Project does not fall under protected area Category 1,” the IFC said. “The intake and tunnel fall under Category 2, and the… power house and part of substation fall under Category 3,” it added. 

Referring to the 2002 law on protected areas, it continued: “Everything is designed in compliance with Article 6, point 3 a) of the law.”

Article 6, point 3 a) of the law does indeed permit activities that “change the natural state of water reservoirs, springs, lakes and water basins”.  It says nothing about whether permission extends to such major projects as building hydropower plants, however.

While Lengarica & Energy insists that the plant is being built in the “sustainable development and traditional use” areas of the national park, the December 2008 government decision – which declared the Hotova Pine area a national park – underlined that only economic activity with a minimal impact on the environment should take place in the sustainable development area.

“In the sustainable development area, which serves as a buffer zone to the Category 1 core area, seasonal economic activities (grazing, collecting medicinal plants, secondary products from the forest), are allowed that do not have an impact on the ecological integrity of the ecosystem,” the decision read.

Contacted by BIRN, the ministries of Energy and Environment said they were awaiting the conclusions of a taskforce set up by both ministries, following the complaints by the local community and the environmental groups.

“We will analyze the conclusions of the joint taskforce in order to find out whether the concerns expressed by the community and civil society have any bases,” Energy Minister Damian Gjiknuri said. 

by

High Performance Polymers for Oil & Gas 2014

These proceedings cover all the presentations from the two day event which was guided by a team of industry gurus, bringing you a broad range of highly topical papers that addressed all of the different aspects to do with the latest developments and technologies that you need to know about in order to stay at the top of your game within this continuously developing market.


[gview file=”https://info.aea-al.org/wp-content/uploads/2014/11/Polymers.pdf” save=”1″]

by

Infrastructure & Utilities in Albania

Infrastructure & Utilities

 Its location at the center of a natural crossroad of the main transport corridors across Europe, places Albania in a strategic geographic position. With the completion of Corridor VIII, the expected implementation of the gas pipeline project TAP, with further development of infrastructures capacities of the leading ports, Albania will connect Mediterranean hub ports and European markets they serve, with the Balkan Region and further with the markets surrounding the Black Sea. The general Albanian transport infrastructure is subject to the general transportation plan, adopted every five years by the Albanian Government, which has recently focused its performance in the construction of new parts of the transport network, especially of the road.

 1)      Air Transport

 The only airport operating in Albania is theTirana International Airport, Mother Tereza situated about 18 km in the northwest (16 km in the airline) of Tirana, which is the largest project and the most important investment in this sector. The geographical coordinates are 41°21′54″V, 19°43′14″L.

Statistical Data
Passengers for 2012 : 1,665,331
Cargo for 2012 : 1,866
Mail : 382

• Airlines routes
Regular routes for 2012 : 18,832
Charter : 1,576

 2) Road transport

In relation to infrastructure, one of the largest projects was the completion of the highway Corridor Durrës – Kukës – Morinë, also called “The Nation’s Road”. This important axis with a length of 170 km, connects the capital and the port of Durres, with the new state of Kosovo.

Albania has approximately 20,000 km of roads and road construction is growing rapidly. Corridor VIII, currently under construction, will connect the Albanian port of Durres with the Varna (Bulgaria) through Tirana, Thana Neck, Skopje, Deve Bair, Sofia, Plovdiv and Burgas. This corridor will be the main east-west connection through Albania and will become an important transport link between the Mediterranean and Balkan countries.

rout albania map

 In 2008, special attention was paid to regional cooperation in the context of road transport with neighboring countries such as Macedonia, Kosovo, Montenegro and Greece. During 2011 were reconstructed across the country 452 km of roads from which 132 km have been completed and 320 are in the process of conclusion. In 2011 began the reconstruction of many major roads, including: Highway Elbasan-Tirana, Librazhd-Qafë Thane, segment Lin-Pogradec etc.

2)       Railway

The railway network in Albania is composed of 441 km of primary railways and 230 km secondary railways. Main priority is the reactivation of the railway network through leverage of private capital and financing international institutions as well as various donors.

3)      Sea transport

Sea transport in Albania is carried out through 4 ports: Durrës, Vlora, Saranda and Shengjini.

The largest and the most important one is the Port of Durrës, which captures  81.8% of all the country’s maritime transport.

 UTILITIES AND COSTS

 ELECTRICITY

Albania has enormous potential for generating electricity through the utilization of water resources (hydro), wind, solar and biomass energy resources.

The public electricity production in 2011 was accomplished mainly by hydroelectric plants; 98.57% of total energy production was from HPP’s and only 1.42% from the TPP of Vlora. The total net production of electricity from generating public companies was 4,021,245 million kWh, while the production from private HPP’s was 136,831 million kWh.

From the comparison of electricity generation during the period 2007 – 2011 large fluctuations are observed from one year to another. Year 2011 isn’t indeed considered a good hydrological year, while 2010 is considered an extraordinary one with energy production amounting to  7,743.295 million kWh.

 WATER

Increasing investments in water supply network and sewerage have further enhanced the status of this sector. Alone in 2010, this sector received about 10 billion ALL of investments, 6.5 billion ALL of which came from the state budget and the remainder from foreign funds. The government passed budget increase in this field to give boost to tourism projects and help areas that face difficulties insupplying water. As a consequence, the National Network the Water Supply was extended by 47 km.

The table below provides a breakdown of the costs of drinking water and contaminated water, to various categories in the major cities of Albania.

 The price of water and sanitation (ALL/m3) for the year 2011

TownDrinking water lek/m3Contaminated water  ALL/m3
 FamiliesInstitutionsPrivateFamiliesInstitutionsPrivate
Sh.A. Tirane45120135113035
Sh.A. Durres58110120152020
Sh.a. U. Elbasan Fshat36110110
Sh.A. Pogradec55110110182525
Sh.A. Fier4480100101214
Sh.A. Berat2880100101012
Sh.A. Sarande4090110142020
Sh.A. Gjirokaster3411012081414
Sh.A. Erseke326080668
Sh.A. Peshkopi276585
Sh.A. Shkoder40110110152020
Sh.A.U. Vlore306080
SH.A.U.K. Lushnje44100110121618

Note: Prices given above do not include VAT

Source:  Albanian Water Regulatory Authority (WRA)

www.erru.al

 TELECOMMUNICATIONS

Albanian telecommunications services includes fixed telephony and mobile telephony. The operator of fixed telephone isAlbtelecom Sh.a., 76% of whose shares are owned by CETEL (Ankara), which is composed of one of the largest companies in Turkey, Calik Group 80% and Turk Telekom 20 percent. While the rest of the shares of 24% is owned by the Albanian government and other stakeholders.

Fixed tariffs applied by AlbtelecomBusinessesIndividuals
ServiceTariffs (ALL)Tariffs (ALL)
Monthly subscription fee1,920530.4
Instalation fee4,8004,800
Transfer00
 BusinessesIndividuals
 Tariffs (ALL/min)Tariffs (ALL/min)
08:00-22:0022:00-08:0008:00-22:0022:00-08:00
Local Calls4.683.903.001.92
Albtelecom Network    
Within the region4.683.903.603.00
Between region11.709.867.666.16
National calls to other fixed alternative operators    
Local4.683.903.603.00
Within the region7.806.245.384.68
Between region17.3312.4810.148.09
Towards mobile operators54.0042.0031.3124.00
International calls    
Zone 123.9918.3818.4614.14
Zone 258.6244.5745.1034.28
Zone 3117.00104.0590.0080.04
Zone 4156.00117.00120.0090.00
Zone 5312.00312.00240.00240.00
Zone 6720.00720.00720.00720.00

Note: All the above prices have been updated according to data provided by Albtelecom by date. 14.08.2012 and do not include VAT

Source: Albtelecom Sh.a., www.albtelecom.al

 MOBILE TELEPHONY

 In late 2011, the number of mobile phone subscribers reached approximately 5.2 million, which represents a penetration rate (number of users per 100 inhabitants) of 185%, a figure which is much higher than the level of 140% in 2010, or the average in the European Union countries by 124% in 2010.

The first mobile operator in Albania, was launched in May 1996 by the Albanian Mobile Communication (AMC), which privatized 85%of total shares worth 85,600,000 euros through COSMOTE Telenor Consortium. The remainder 12.6% of state shares was privatized in March 2009 for a value of 48,200,000 euros. AMC has the highest number of employees in the telecommunications sector with over 500 specialized employees.

Licensed in 2001, Vodafone Albania was the second mobile operator in Albania. Vodafone’s GSM network covers 90.86% of the territory of Albania and the 99.6% Albanians in rural and urban areas.

Eagle Mobile, the third mobile operator in Albania, entered the market in October 2008. The company had an increase of 35% in the number of users from the year 2010 to year 2011.

In the year 2009, the fourth  licensed mobile operator Plus Communication  entered the Albanian market. This was a “joint venture” between several Albanian local companies and Kosovo Post Telecommunication. The company had an increase of 370 thousand users comparing to 2010.

INTERNET SERVICE

According to data pertaining to the first half of 2010, 96 Internet providers are currently operating in Albania. Most of them are located in Tirana and other cities in western Albania. Internet is mainly offered  through ADSL and the Hybrid Fiber-Coax. According to Electronic and Postal Communications Authority – (AKEP)data, with the increase of the broadband Internet users for the year 2011, their number reached 161,000. For the same period, the number of broadband lines per 100 inhabitants rose to around 6.2%, compared to 3.7% that was at the end of 2010.

The leading internet service providers include:

Albtelecom      www.albtelecom.al

Albaniaonline www.albaniaonline.net

Abcom            www.abcom.al

Abissnet          www.abissnet.com.al

Interalb           www.interalb.net

Primo              www.primo.al