The energy sector is one of the most important ones in the country economy. The supply of the energy according to the sectors is based on hydro-energy, being considered as the primary energy source up to the fossil fuels, wood etc. The history of the traditional sources can be carefully considered for a further analyses and forecast of the energy demand. This would help to an effective intervention and better control of the increasing trend in energy demand as well as to decrease the existing energy dependence. This analyses is important to assess the energy needs afforded by RES, which have never been considered in the energy analyses.

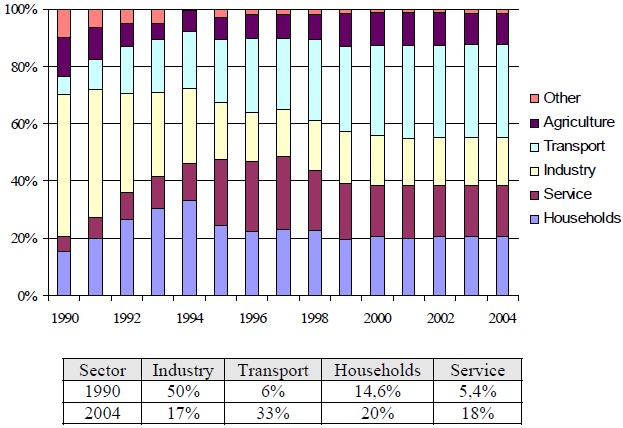
Figure 18 The consume of energy sources divided by sector
Taking into consideration the energy consume in different sectors, it can be easily noticed that this consume has huge ups and downs during the years 1990-2004, as shown in the figure above. As the country was oriented towards the heavy industry before 1990, the energy consume was considerably higher than the first years of transition. During the years 1995-2000 the energy consume has decreased up to 1/3 of the consume level of 1990. It can be easily concluded that there are high differences which call for future special attention on the energy demand.
Extracting and use of the energy sources in Albania
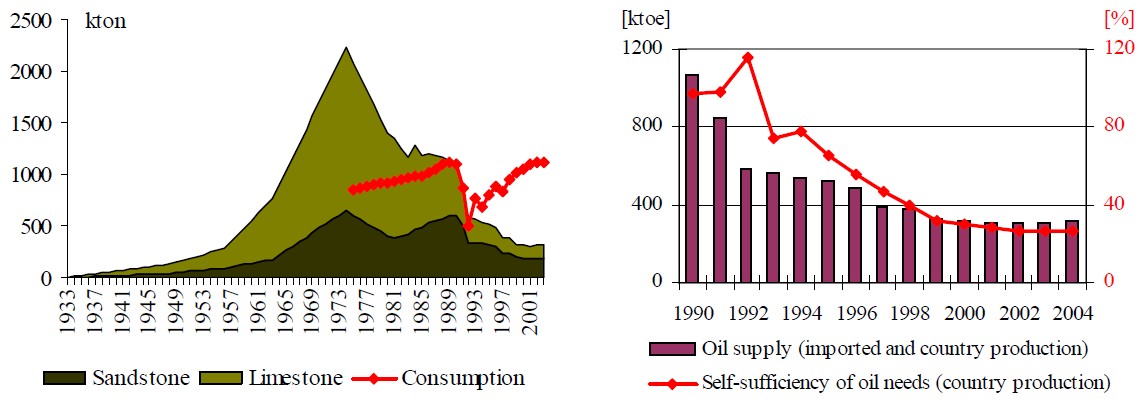
The oil sources in Albania are distributed in the West and Southwest. They derivate mainly from the two structures, the sand rocks and lime stones. The geologic slack of oil is assessed of 260 million m3, 54 million m3 out of which are accessible. The geological slacks of oil in the sea are assessed to be up to 200 milion m3, 50 milion m3 out of which can be taken out1. The usage of oil in Albania has started since 1918, whereas the peak was in 1975. Eversince the usage of oil has always been decreasing, and from 1990s on it experienced a continous consume increase. This contradiction between the usage and consume has led to a dependence on the fossil fuel contries since years 90s. The difference between the usage and the consume has been increasing as a result of the transport development sector. Until 1989 Albania has been an exporter of oil products. Actually, imported oil and its products contribute approximately of 63% of primar energy sources.

Figure 19 The production, consume & self sufficiency of oil supply
The oil refining has been done mainly through four refineries available in Cerrik, Fier, Kucove and Ballsh. After the construction of the refineries in Ballsh, the other three refineries did not function in full capacity. The oil fields result with a high percentage of sulphur (4% – 8%) and high gravity (8 – 35 API). The technologies used in the mentioned refineries are quite old and give serious problems uncontrollable pollution. Therefore new investments are needed for further usage of them. A general technical-economic analysis would assess this kind of investment versus the investment on the renewable energy.
Coal is one of the main sources in country and it is concentrated in four main areas (see Annex C). The systems of coal enrichment in Valias, Memaliaj and Maliq are already out of function. The coal has mainly been used as a source for central heating and electrical energy production from TPP (co-generative), that are built near the coal mines. In general, the country coal has resulted to a high percentage of sulphur (around 4%) and a high percentage of ash and wetness. Therefore the coal results to a low calorific value with high emissions of SO2. The mine characteristic is that it is located in high depths (over 200 m) and in strata of relatively small amounts (70 – 100cm). As a result the country coal has a higher cost than the imported coal. This is one of the reasons that the use of the coal had a drastic decrease in the last years.
The production and the natural gas consume has started since 1963 and gradually have been discovered other gas fields such as: Divjakë, Frrakull, Ballaj-Kryevidh, Durrës, Povelçë, and Panaja–Delvinë. Around 500 wells have been constructed until the end of 1995; out of which approximately 3.04 billion m3 of natural gas have been taken out. Actually, the gas fields are in their final phase. The numbers of the wells are decreased to 30 and the daily collections can be up to 300-1500 m3N/day. The gas slacks have a decrease since 1995, but the peak was in 1990 as a result of identification lack of new sources and investments in the existing fields.
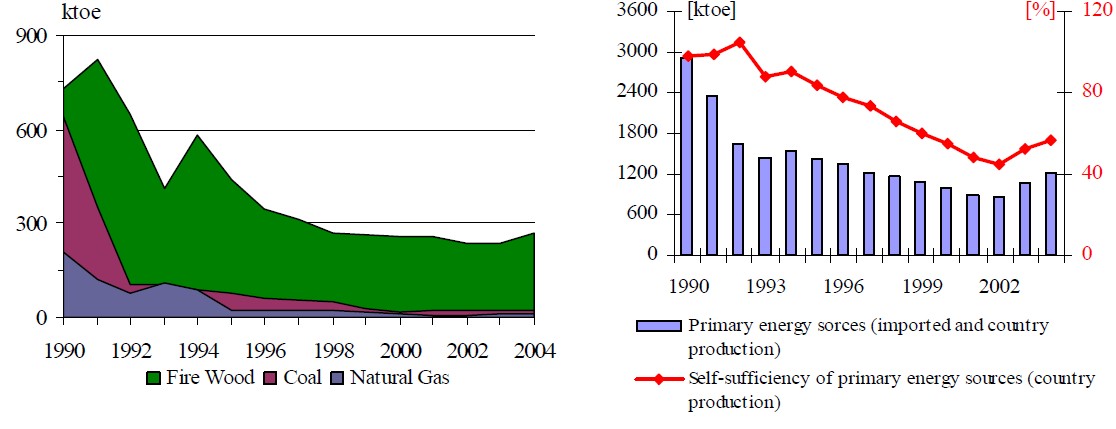
A very important source, which has given a considerable contribution to the energy balance of the country, is biomass and more specifically the woods. The usage of woods has also been decreased in the last years. During 1990 the fire woods contributed with 727.7 ktoe (or 24.6% of the total) falling until 271.4 ktoe in 2004 (12.5% of the total). This decrease has influenced positively in the minimization of the wood cuts, and simultaneously has had a negative impact since more electrical energy has been used, especially in the residential sector.
According to the data from the General Directorate of Forests, the total slack of the fire wood goes up to 14,3 Mtoe. The usage of fire wood, coal and natural gas in years and the percentages compared to the total of energy sources is given below.

Figure 20 The production and self sufficiency of primary energy sources for the period 1990 – 2004
The energy provided by the HPP and TPP

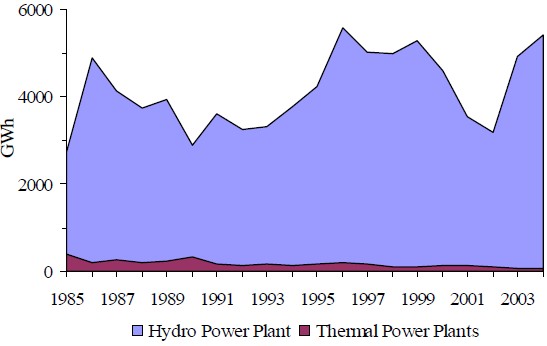
Figure 21 The production of electricity from TPP and HPP for the period 1985 – 2004
Albania has a high potential of hydro-energy, 35% out of which is used so far. The installed capacity up to now is 1464,5 MW. The average production of HPP in Albania is about 4362 GWh/year. The total slacks of hydro-energy are up to 3000 MW and the annual potential can be up to 10 TWh (Xhelepi 2006). A great importance is given recently to the use of the rivers in the central and the southern part of Albania, in order to have a geographical hydro-energy balance. 8 TPP have been installed in different time periods and capacities. The main common quality is the co-generation. Actually, all the TPP are out of function, except from Fier one, which works on a super minimal capacity. More details and technical characteristics of existing HPP and TPP and those that are planned to be constructed are given on Annex B.
The provision of the energy demand divided by sectors
The generating capacity is insufficient to face the today demand of 6.60 TWh/year (year 2006). The technical production has an average of 10-12 million kWh/day and the import can go to 8-10 million kWh/day. Therefore a total maximal supply of 18-22 million kWh/day can be provided. The required consume in a normal winter day is 25-27 million kWh. As a result, the electroenergy system is sufficient for 70-80% of the total energy demand during the winter peak, leading to power cuts. According to the NSE, this situation has a resulted to a trade defficit of 25.6 Milion USD in 1990. In 2004 imports go up to 310 million USD/year. To have a clear view, the trade deficit of 2004 is around 1272 Milion USD/year. 25% of this deficit consists of energitic comodities (sub-products of oil and electric energy).
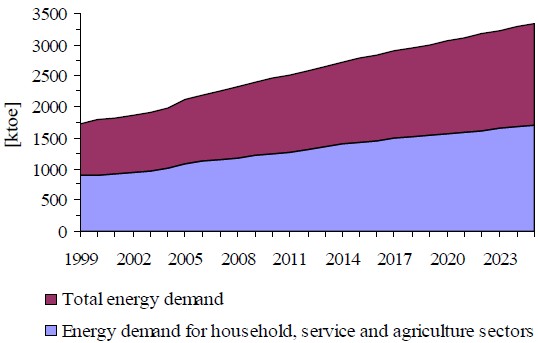
The following forecast of the energy demand for the period 2005-2025 is based on the NSE. The energy demand forecast for each sector of economy has been done according to the same scenarios and trends of NSE.

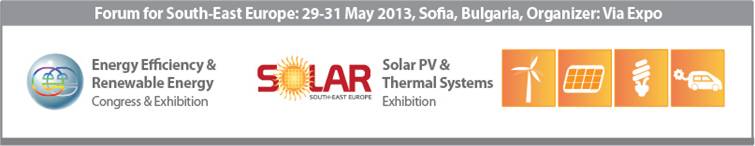
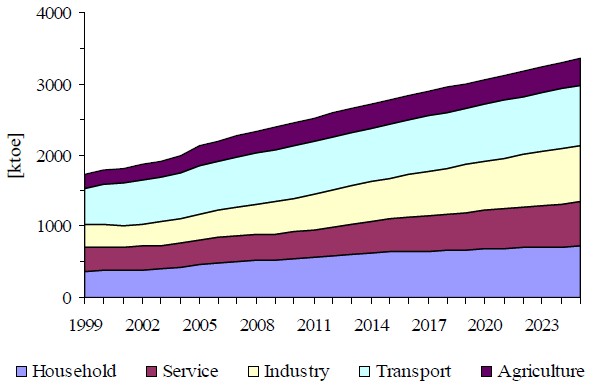
Figure 22 The provision of energy demands divided by sectors

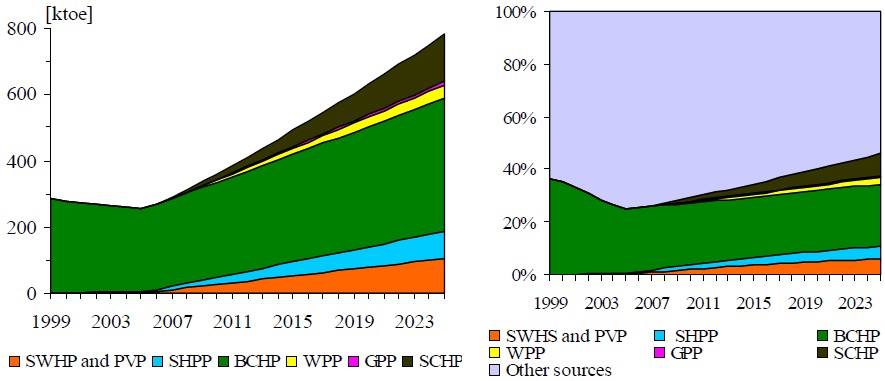
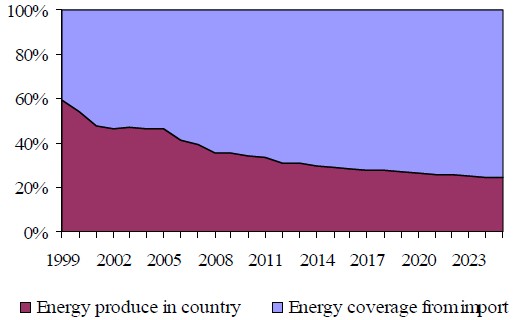
Figure 23 The supply of primary energy sources made-in country and imported
Albania dependence on energy imports is already 55% and is expected to increase over the coming years up to 70% by 2025 in case of no intervention (see figure 16). The following figure presents the coverage of the foreseen energy demand from the country energy sources and import for the coming 20 years.
Much attention will increase therefore the focus on security of supply. In this framework, one of the main challenges in the Albanian energy sector is the diversification of the energy sources and the self-sufficiency of energy demand with the country sources, reducing the import dependence. Renewable energies as indigenous sources of energy will have an important role to play in reducing the level of energy imports with positive implications for balance of trade and security of supply.
![Figure 27 Unit cost for each technology and each capacity [cent/kWh]](https://info.aea-al.org/wp-content/uploads/2013/03/AEA_40.jpg)