The reduction of the GHG emission based on the utilisation of RES
The climate change represents a global problem. Actually, all the countries contribute in different scales to the green house gas (GHG) emitting and climate changes. As such, the climate changes influence in the temperatures increase, less raining and a higher sea level. Less raining leads to an increase of dryness, to less energy produced from hydro power plants and as a result it impacts in the economic development of each country. These phases highly harm the efforts for poverty reduction and the achievement of Millennium Development Goals.
Fossil fuel impact to human health and environment
The usage of fossil fuels as: petroleum, oil, natural gas has an enormous influence in the human health and the natural equilibrium. With regard to the human health, the fossil fuel high consumption leads to cancer or other chronic breath diseases, while its impact in environment is mainly related to the global warming and the degradation of earth, water sources and air pollution.
The organic stuff burning for the production of the electric energy is the main source of the carbon dioxide emitting (CO2), which is the major contributor to the global warming and climate change issue. The scientists foresee that our planet will constantly be warmer if the concentration levels of the carbon dioxide will be increasing. Higher temperatures will influence to the extreme weather changes and in devastated earth. The burn of the fossil fuel for the production of the electrical energy is the main cause of the air pollution. This process generates a lot of polluters as nitrogen oxides NOx, sulphur oxides SOx, hydrocarbons HxCy, dust, smog, and other materials in suspension. These polluters can influence in serious problems to asthma, lung irritation, bronchitis, pneumonia, reduction of breath organ resistance on infections and preliminary death.
Nitrogen oxides present themselves in the form of yellow to brown clouds in the horizon of many cities. They can lead to lung irritation, cause bronchitis and pneumonia as well as reduce the resistance toward breath infections. The transport sector is responsible for a considerable amount of emitting of NOx and the TPP are responsible for the major part of NOx emitting.
The sulphur oxides are the results of sulphur oxidation in the fuel. The equipment that use the coal for the production of the electric energy, produce around two third of the emitting of SOx. These gases are combined with the water steams that are in the form of sulphur and nitric acids, which become part of the rain and snow. Acid rain damages the whole live world in the rivers, lakes, minimizes the agriculture production and damages the buildings.
The hydro-carbons are major part of the polluters. They are compounded of hundreds of specific combinations, which contain carbon and hydrogen. The simplest hydrocarbon is methane (CH4), which does not enter easily into reaction with NOx to form smog, but the other part of the hydrocarbons do so. The hydrocarbons are emitted from human sources such as: emitting from vehicles, the steam of gas-oil and the oil refining.
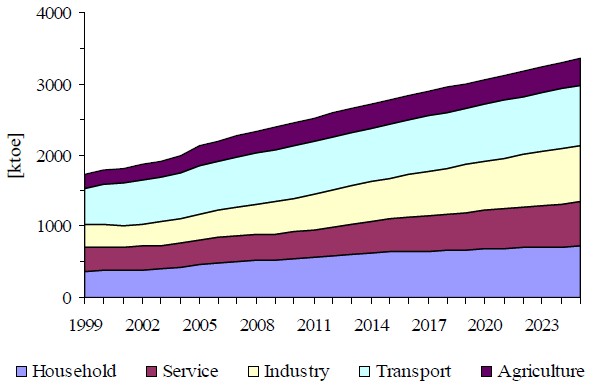
It is very important, as well, to have a figure out of how the energy is produced and how it is used. In order to use in the future a kind of energy that does not lead to problems of the global warming, it is needed to see towards the renewable energy sources as: sun, wind, hydro-energy, biomass and geothermic. These sources do not contain and do not emit CO2 or other polluters during their usage. They do not also produce air polluters and they are never finished. Using the fuel from wood or other plants (energy and biomass) which free CO2, they do not contribute in the global warming. During their growing they consume the carbon, creating therefore a closed cycle.
Emission reduction of RES use
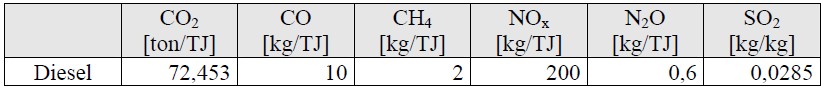
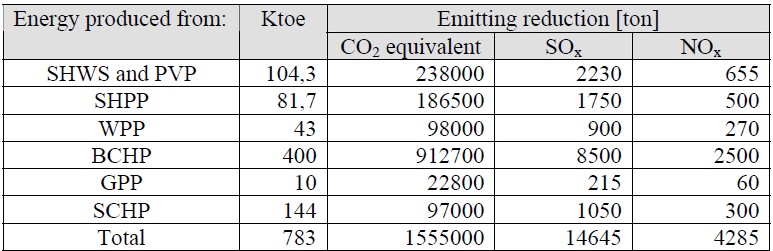
Table 8 The emitting unit coefficients
The foreseen energy for each RES multiplied to these coefficients, give the emitting that can be avoided using the RES according to the potentials described above. Because the electrical energy is not only supplied from fossil fuel, the emitting part of the TPP energy for the 20 years is considered. This coefficient for the study period is 0,3 which means that the electric energy system in Albania will be supplied 30% from the TPP in the next 20 years.
Having the assessment done for the amount of energy that will be provided during the period 2005-2025 from the use of renewable energies, we can calculate the emissions of CO2 equivalent, SOx, NOx, in case this energy would be supplied from TPP burning diesel.
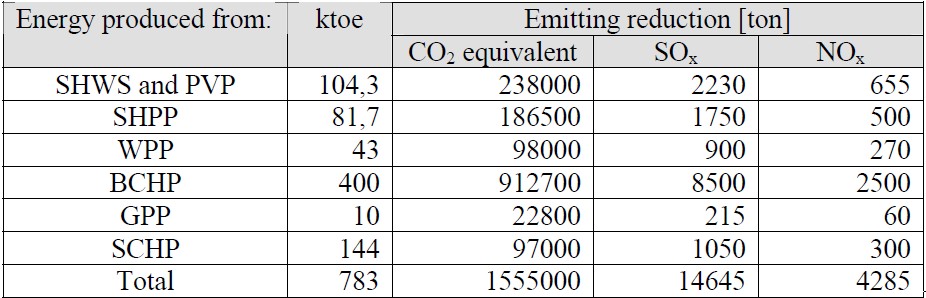
Table 9 Emission reduction from the use of RES
Based on the forecast of the renewable energy penetration, it is calculated the quantity of GHG (Green House Gases) that can be avoided as shown in the following graphics.
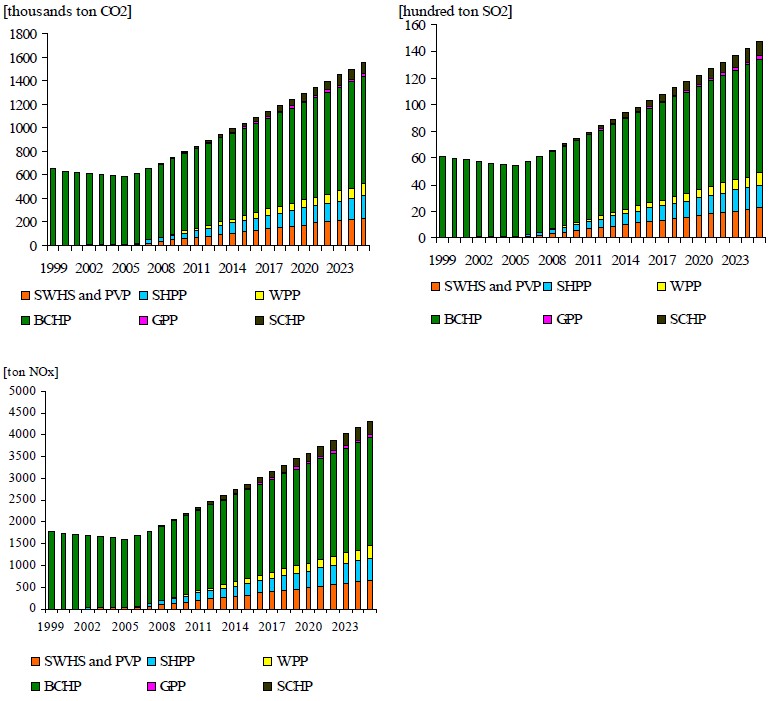
Figure 28 GHG emitting avoided from RES usage
Kyoto Protocol and Clean Development Mechanisms Projects
The Protocol of Kyoto is established in December 1997 in Kyoto, Japan. It includes legal obligations for 40 industrialized countries, comprising 11 countries of Central and Eastern Europe and aims in the reduction of the green house gas of 5 % lower than in 1990, as an average for the first obligation period: 2008-2012. The Protocol of Kyoto includes the cooperation mechanisms compiled to enable the industrialized countries (Parties of Annex I) in order to reduce the achievement costs through the reduction of the emitting of GHG in other countries, where the cost is lower than own countries. These mechanisms tent to reduce the cost and take measures against the climate change phenomena.
CDM is the only flexible mechanism of Kyoto Protocol that includes countries that are not counted in Annex I of Protocol where Albania participates. CDM is a mechanism defined from the Protocol of Kyoto related to the projects implementing components that consist of reduction of GHG or their sequestration. This mechanism gives to the countries and private companies the chance to reduce the emitting worldwide – on the lowest cost – and they can be further counted in credits assessed from organs and specialized entities and accredited according to their objectives.
Through the emitting reducing projects, the mechanism can stimulate investments and ensure the main source for a cleaner development of the economy all around the world. CDM, in particular, aims to assist the countries in development towards the sustainable development and stimulation of the pro-environment projects from businesses and government of the industrialized countries.
CDM can be implemented in the following sectors/categories:
- The improvement of the energy efficiency to the consumer;
- The improvement of the energy efficiency in the supply system;
- The renewable energy sources;
- The change of fossil fuel;
- Agriculture (the reduced discharge of CH4 and N2O);
- The industrial processes (CO2 from cement etc., HFCs, PFCs, SF6);
- Sink projects (only forest and deforest)
In order to participate in a CDM, considerable number of criteria has been set for the countries to implement this kind of project. All the participatory parties need to meet the three requirements, as following:
- Voluntary participation in CDM,
- The establishment of a National Authority for CDM, and
- The ratification of Kyoto Protocol.
Furthermore, the industrialized countries need to meet other participation requirements, such as:
- The respecting of Article 3 of Kyoto Protocol related to the definite amount of discharges,
- The establishment of national system of the GHG assessment,
- The establishment of the national register of the GHG discharge,
- The development of an annual inventory, and
- The establishment of an accounting system for the sell and purchase of the reduced discharge.
In order to be eligible, a CDM project has to:
- Be implemented in accordance with the national policies and relevant strategies of the project hosting country and in a broader context with the policies for a sustainable development.
- Be “complimentary” which implies the reduction of the discharge being present despite of the project implementation.
There is a lot of financial profiting from the organization implementing CDM project. Initially the sell of CER known as “carbon mortgage” generates additional project incomes. Secondly, the CDM project can be a solution for the diversification and reduction of investment risk in this project. The implementation of CDM project can be part of the strategy for the company increase in the hosting or investing country, which, anyway, improves the image of the company in the framework of the global competition.
The scheme presented below shows the cycle in which the CDM project goes through. According to this scheme, each project has the following basic phases: (1) the project formulation, (2) national approval, (3) approval and registration, (4) project funding, (5) monitoring, (6) verification/certification and (7) issuing of CER. The first four phases are prior to the project implementation, while the last three are during the whole project duration: the Figure 29 gives information related to the responsible institution for each project phase, starting with the National Authority, and later with the Executive Board and Operational Entities which are diverse as far as the assessment or verification is concerned.
Conclusions
As a conclusion of the analyses on RES potentials in Albania, it results that it belongs to the group of countries of considerable potentials in using these kind of sources.
The average annual quantity of rain in the country territory is approximately 1400 mm, reflected in a dense hydrographic system with high potentials for the SHPP constructions.
The amount of solar energy provided by solar radiation is high, as well. This amount can be up to 1600 kWh/m2 annually in the Western Lowland. The solar days vary from the average of 240 – 260 days to 280 – 300 days annually in the South-West.
The wind annual average speed in the majority of the country is up to 3 m/s. The areas of high potentials for further detailed studies on wind as a renewable energy source are: Alps of Albania, Lezhë – Mamurras, the central mountanous area, the coastal hilly area of Adriatic sea, the hilly and mountanous area of Jonian sea and the highlands of Beratit-Corovodës-Tepelenë-Ballsh area.
The most profitable spot (taking into consideration the constuction infrastructure) for pilot projects on wind and solar sources are: the entrance of Lezhe, the hills of Kryevidh (near Spille beach), Xarre (south of Saranda), the area between Berat and Këlcyrë.
Albania represents a country of real geothermy energy of low enthalpy, still unused. It could contribute, though, to a balance of the country energy system. The building heating and cooling of buildings, green houses and swimming-pools through the modern and profitable system: cliffs heating sources – wells – vertical heating exchange – geothermic pumps should be the main directions of country geothermic energy use. Llixha of Elbasan, Peshkopi, Kozani-8 and Ishmi – 1/b wells result to be the most attractive areas in using this kind of RES.
Actually, the fire woods for heating and cooking are the only biomass components used. Given the old technology in use, the coverting yield of this RES is quite low, 35-40%.
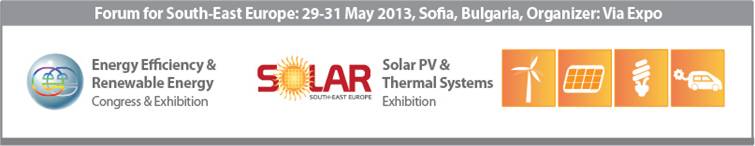
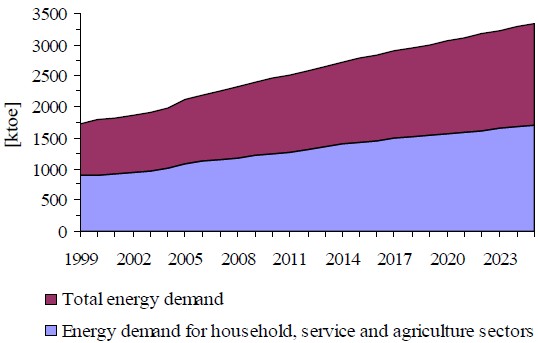
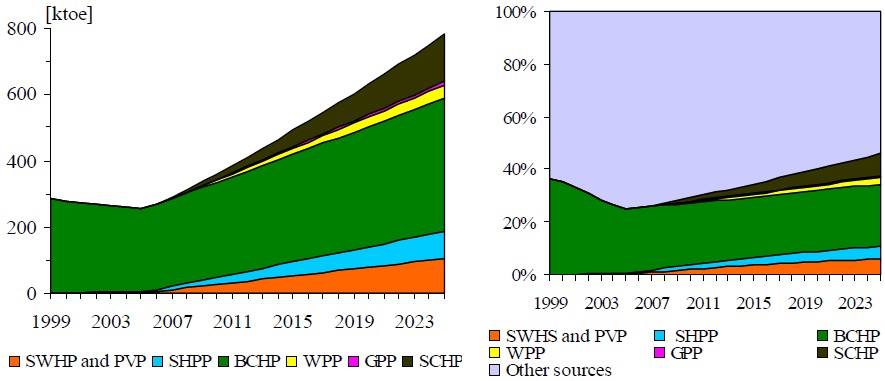
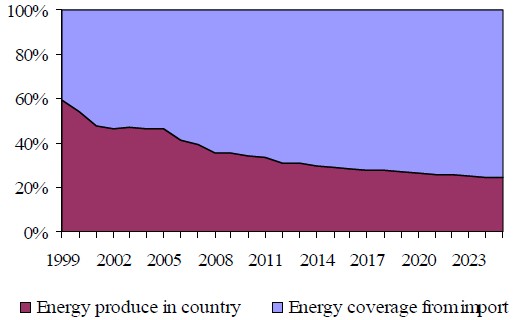
Renewable energy sources still make an unacceptably modest contribution to the country energy balance as compared to the available technical potential. In fact a quantity of 800 kilo ton oil equivalent can be generated from the renewable energy sources until 2025. This quantity is 58 % of the total energy demand for the three main sectors: household, service, and agriculture. It can also be equivalent with 30% of the energy import for the same period.
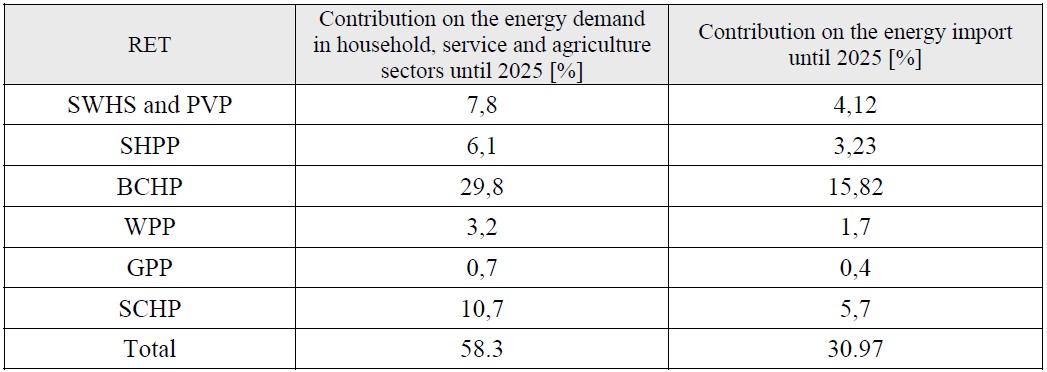
Albania dependence on energy imports is already 55% and is expected to increase over the coming years if no action is taken, reaching 70% by 2025
From penetration of RET in our market it will be possible the production of around 800 ktoe green energy and at the same time the considerable reduction amount of GHG.
Recommendations
First and foremost, without a coherent and transparent strategy and an ambitious overall objective for RET penetration; these sources of energy will not make major inroads into the country energy balance. Technological progress by itself can not break down the several nontechnical barriers which hamper the penetration of renewable energy technologies in the energy markets. Without a clear and comprehensive strategy accompanied by legislative measures, their development will be retarded. A long-term stable framework for the development of renewable sources of energy, covering political, legislative, administrative, economic and marketing aspects is in fact the top priority for the economic operators involved in their development.
According to the preliminary financial analyses of cost-benefit for RET, it results that the technologies needed to be promoted in the future through the implementation of respective projects based on a full financial profiting analyses and full analyses of environment impact are: SHPP used for the electricity, solar panel for water heating in household and service sectors, the efficient heaters in the third area (division according to grade-days warm), where the heating needs are to a considerable level.
It is considered as profitable the implementation of a study project on the wind speed indicators for the premising areas according to this study. It is, as well, recommended to ensure the progress of further studies in identifying the sectors/areas/regions/consumers, where the implementation of relevant projects on geothermic, urban waste and photovoltaic plants results profitable.
A significant group that can be used for energy profit is related to the extensive richness of bushes (which can be undoubfully as a renewable energy source as they keep on growing again).
Introduction of a financial support scheme for renewable energy is crucial for their development. The support scheme should overcome the current additional costs for energy production from renewable energy sources compared to fossil fuels.
The dissemination in a highly wider range of the RES potentials through the fiche-projects are crucial for attract (foreign) investors in renewable energy projects, for example by introducing interested parties in the resources, or by facilitating them under the Kyoto framework, i.e. support CDM projects. The CDM mechanism is potentially especially interesting as a financing mechanism to support investment decisions for biomass projects. Establishment of Renewable Energy Development Centre is fundamental.
![Figure 27 Unit cost for each technology and each capacity [cent/kWh]](https://info.aea-al.org/wp-content/uploads/2013/03/AEA_40.jpg)